Hi there 
I want to build a nice X-Y Chart, where working points are moving around fancy and the background is based on data, not pictures 
I’m currently using the LV_CHART_TYPE_SCATTER type and
adding points with the lv_chart_set_next_value2() function.
Here is a sneak peak how it looks at the moment:
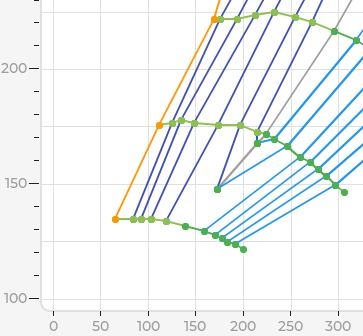
- So how can i get rid of those dots? → fixed: on draw event set points transparent
- How can i fix the scale?
I want to show numbers with more precision not integers on the scale. - How can i make longer lines? → fixed: lv_chart_set_point_count(chart, 11);
- Also I want it to be more fancy, is there something like a spline function?
- I want also want to add a dashed line
Thanks for Help,
Greetings Silvester
More questions to come