Description
Please see below code and screenshots,
Screenshots,
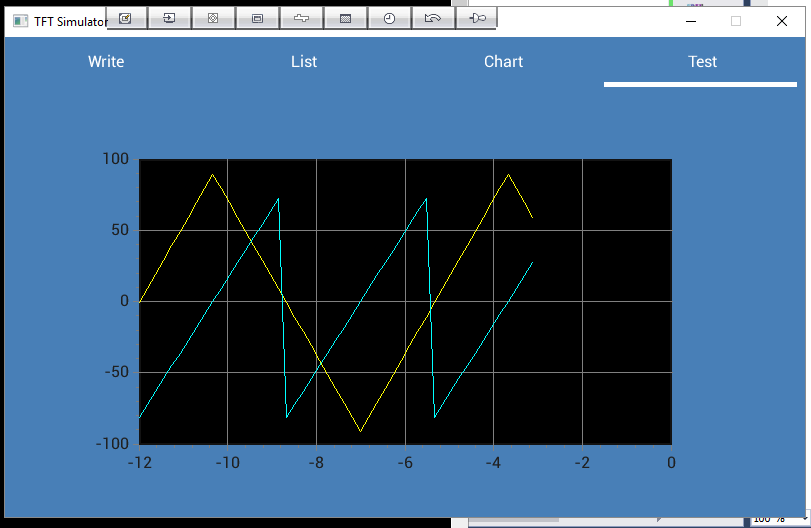
- The first is an incomplete trace, All good.
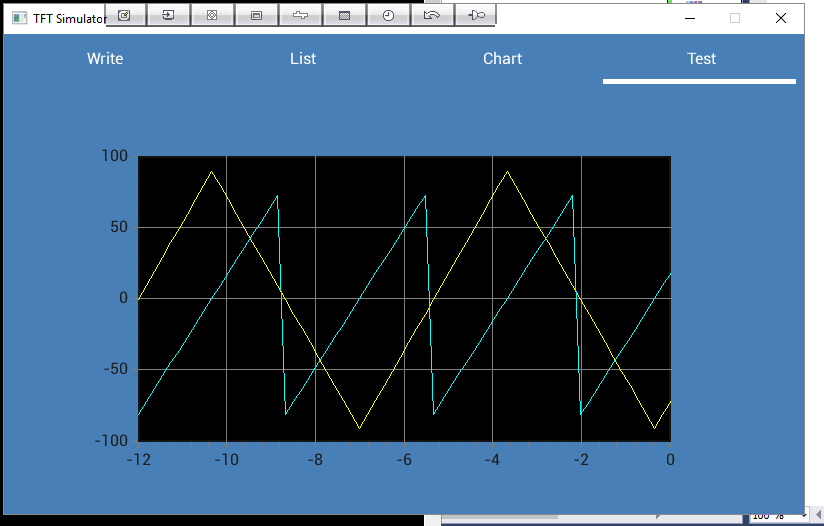
- The second is a complete trace, All good.
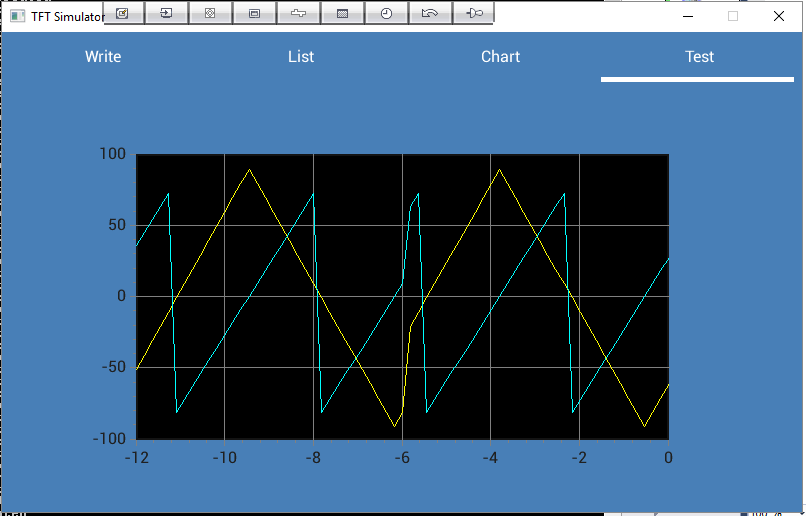
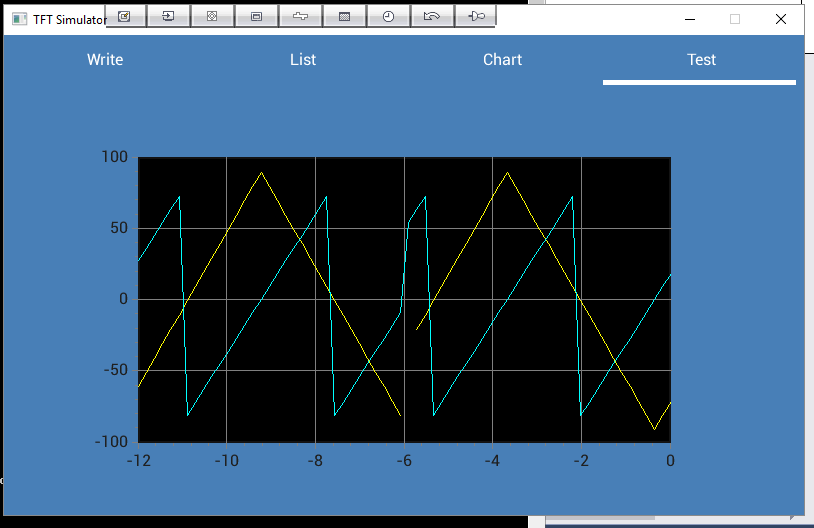
- The third is 1.5 traces.The newest and oldest points are connected. For me not so good.
My main question is how do I prevent this ?
A second question is how would I achieve the same thing if I were directly setting the points.
IE ser->points[i] = value;
Is there a description on LV_CHART_TYPE_VERTICAL_LINE chart type, how it differs from a normal line chart ?
Code to reproduce
#define WAVES_TRACES	3/4
//#define WAVES_TRACES	1
//#define WAVES_TRACES	3/2

#define CHART_Y_MAX		100
#define CHART_Y_MIN		-CHART_Y_MAX

static lv_coord_t wv_triangle( void )
{
	static bool down;
	int32_t delta = CHART_Y_MAX/10;
	static int32_t sample = CHART_Y_MIN/10;

	sample += down ? -delta : delta;

	if( (sample >= CHART_Y_MAX*9/10) ||
            (sample <= CHART_Y_MIN*9/10) )
		down = !down;

	return sample;
}

static lv_coord_t wv_sawtooth( void )
{
	int32_t delta = CHART_Y_MAX*9/100;
	static int32_t sample = CHART_Y_MAX;

	sample += delta;
	if( sample > CHART_Y_MAX*8/10 )
		sample = CHART_Y_MIN*8/10;

	return sample;
}

#include <stdio.h>
void test_chart_create ( lv_obj_t * par )
{
	lv_coord_t w_par = lv_obj_get_width( par );
	lv_coord_t h_par = lv_obj_get_height( par );

	lv_obj_t * chart = lv_chart_create( par, NULL );
	lv_obj_set_size( chart, w_par * 2 / 3, h_par * 2 / 3 );
	lv_chart_set_range( chart, CHART_Y_MIN, CHART_Y_MAX );

	lv_chart_set_margin( chart, 50 );
	lv_chart_set_x_tick_length( chart, 5, 2 );
	lv_chart_set_x_tick_texts( chart,
		"-12\n-10\n-8\n-6\n-4\n-2\n0",
		5,
		LV_CHART_AXIS_DRAW_LAST_TICK
	);
	lv_chart_set_y_tick_length( chart, 5, 2 );
	static char buf[128];
	sprintf( buf,
		"%d\n%d\n%d\n%d\n%d",
		CHART_Y_MAX, CHART_Y_MAX/2,0,CHART_Y_MIN/2,CHART_Y_MIN
	);
	lv_chart_set_y_tick_texts( chart,
		buf,
		5,
		LV_CHART_AXIS_DRAW_LAST_TICK
	);

	lv_obj_align( chart, NULL, LV_ALIGN_CENTER, 0, 0 );

	lv_chart_set_type( chart, LV_CHART_TYPE_LINE );
	//lv_chart_set_type( chart, LV_CHART_TYPE_VERTICAL_LINE );

	static lv_style_t style_chart;
	lv_style_copy( &style_chart, &lv_style_pretty );
	style_chart.body.opa = LV_OPA_100;
	style_chart.body.radius = 0;
	style_chart.body.main_color = LV_COLOR_BLACK;
	style_chart.body.grad_color = LV_COLOR_BLACK;
	style_chart.line.color = LV_COLOR_GRAY;
	style_chart.line.width = 1;

	lv_chart_set_update_mode( chart, LV_CHART_UPDATE_MODE_CIRCULAR );

	lv_chart_set_style( chart, LV_CHART_STYLE_MAIN, &style_chart );
	lv_chart_set_series_opa( chart, LV_OPA_100 );
	lv_chart_set_series_width( chart, 1 );
	lv_chart_set_series_darking( chart, LV_OPA_TRANSP );

	uint16_t chart_pnt_cnt = lv_obj_get_width( chart )/8;
	lv_chart_set_point_count( chart, chart_pnt_cnt );

	lv_chart_series_t * ser1, *ser2;
	ser1 = lv_chart_add_series( chart, LV_COLOR_YELLOW );
	ser2 = lv_chart_add_series( chart, LV_COLOR_AQUA );

	int i, samples = chart_pnt_cnt * WAVES_TRACES;
	for( i = 0; i < samples; ++i )
	{
		lv_chart_set_next( chart, ser1, wv_triangle() );
		lv_chart_set_next( chart, ser2, wv_sawtooth() );
	}
}


