I found that chart widget auto draw lines in two modes:
- if points number is larger than width, it enable
crowded_mode, hide points - if not, it will draw lines and show points on it
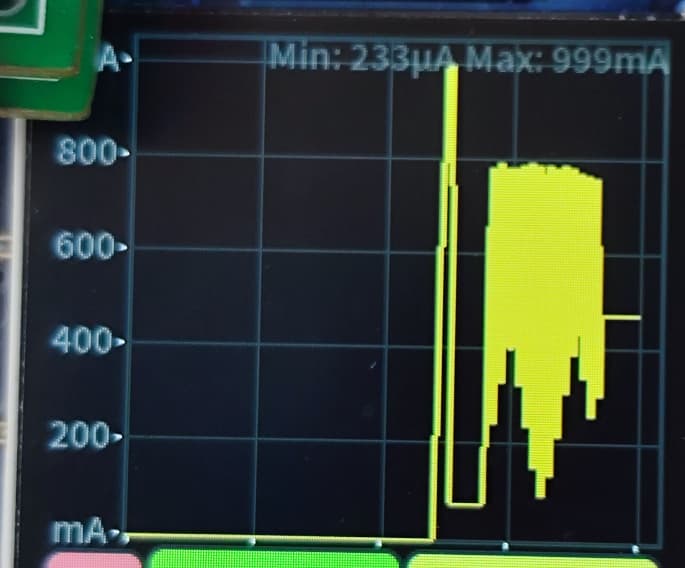
now I need to show 200 points in a chart which is 180 pixel width, so it enable crowded_mode, like this, very ugly…
then I editor source code of lv_chart.c
- disable
crowded_mode, it will always befalse - delete
draw pointcodes
shows like this:
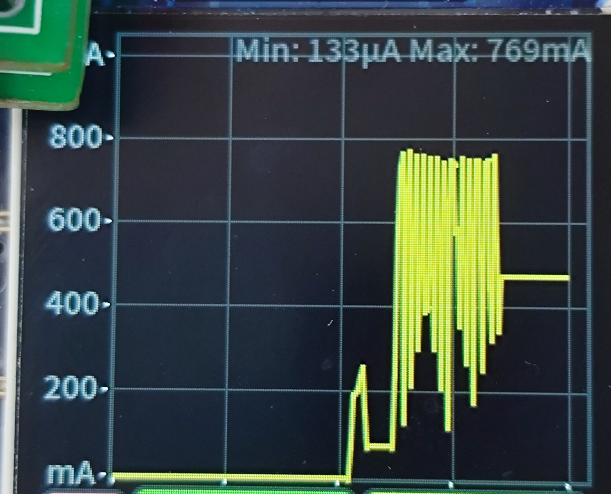
looks much better
so, I need to disable crowded_mode and hide all points, is it possible to add an interface to configure this function?