Description
As per topic title,
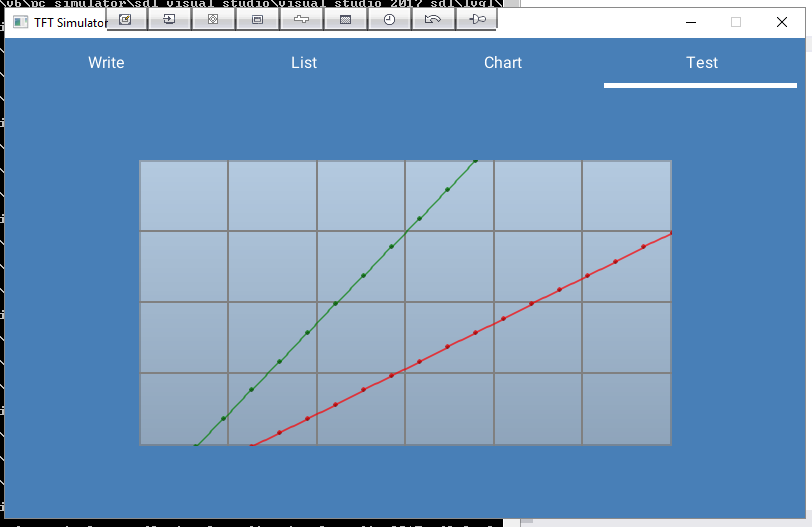
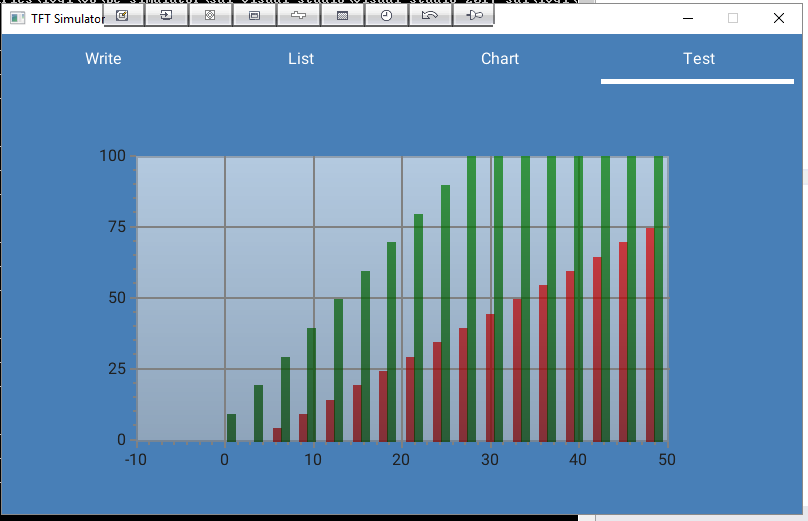
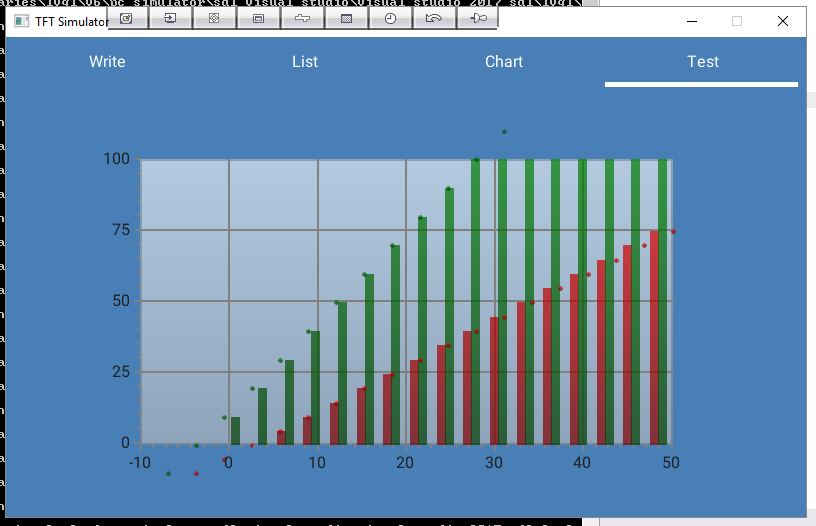
It seems that the chart lines extent in the vertical direction (in pixels) beyond the min/max range (set by lv_chart_set_range) by the margin (set by lv_chart_set_margin).
A mouthfull, but I am sure you get the drift 
What MCU/Processor/Board and compiler are you using?
visual_studio_2017_sdl simulator
What do you experience?
As described above
What do you expect?
Informing you and hoping it will be fixed, unless I am not doing something correcly.in which case I will gladly take any advice.
Code to reproduce
#define CHART_SET_MARGIN	1
#define CHART_SET_TICKS		1
static void test_chart_create ( lv_obj_t * par )
{
	lv_coord_t w_par = lv_obj_get_width( par );
	lv_coord_t h_par = lv_obj_get_height( par );

	static lv_style_t style_chart;
	lv_style_copy( &style_chart, &lv_style_pretty );
	style_chart.body.opa = LV_OPA_60;
	style_chart.body.radius = 0;
	style_chart.line.color = LV_COLOR_GRAY;

	lv_obj_t * chart = lv_chart_create( par, NULL );
	lv_obj_set_size( chart, w_par*2/3, h_par*2/3 );
	lv_chart_set_range( chart, 0, 100 );

#if CHART_SET_MARGIN
	lv_chart_set_margin( chart, 40 );
#endif
#if CHART_SET_TICKS
	lv_chart_set_x_tick_length( chart, 5, 2 );
	lv_chart_set_x_tick_texts( chart,
		"-10\n0\n10\n20\n30\n40\n50",
		7,
		LV_CHART_AXIS_DRAW_LAST_TICK
	);
	lv_chart_set_y_tick_length( chart, 5, 2 );
	lv_chart_set_y_tick_texts( chart,
		"100\n75\n50\n25\n0",
		5,
		LV_CHART_AXIS_DRAW_LAST_TICK
	);
#endif

	lv_chart_set_type( chart, LV_CHART_TYPE_POINT | LV_CHART_TYPE_LINE );
	lv_chart_set_style( chart, LV_CHART_STYLE_MAIN, &style_chart );
	lv_chart_set_series_opa( chart, LV_OPA_70 );

	lv_chart_set_point_count( chart, 20 );

	lv_chart_series_t * ser1, *ser2;
	ser1 = lv_chart_add_series( chart, LV_COLOR_RED );
	ser2 = lv_chart_add_series( chart, LV_COLOR_GREEN );

	int i;
	for( i = 0; i < 20; ++i )
	{
		ser1->points[i] = -20 + i*5;
		ser2->points[i] = -20 + i*10;
	}

	lv_chart_refresh( chart );
	lv_obj_align( chart, NULL, LV_ALIGN_CENTER, 0, 0 );
}
Screenshots
With Margin,
#define CHART_SET_MARGIN    1
#define CHART_SET_TICKS     1   /* Or 0 */
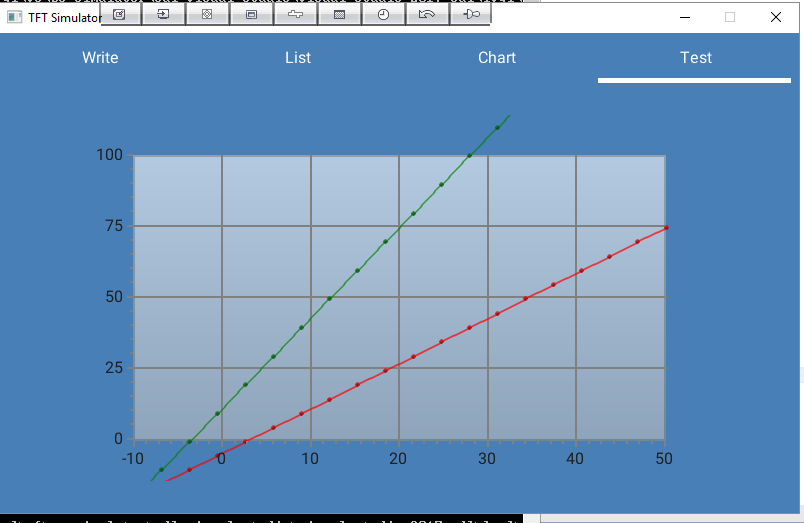
#define CHART_SET_MARGIN 0
#define CHART_SET_TICKS  0    /* Or 1 */