My recent experience with the Chart widget, displaying oscilloscope style real time signals, surfaced out a few ideas:
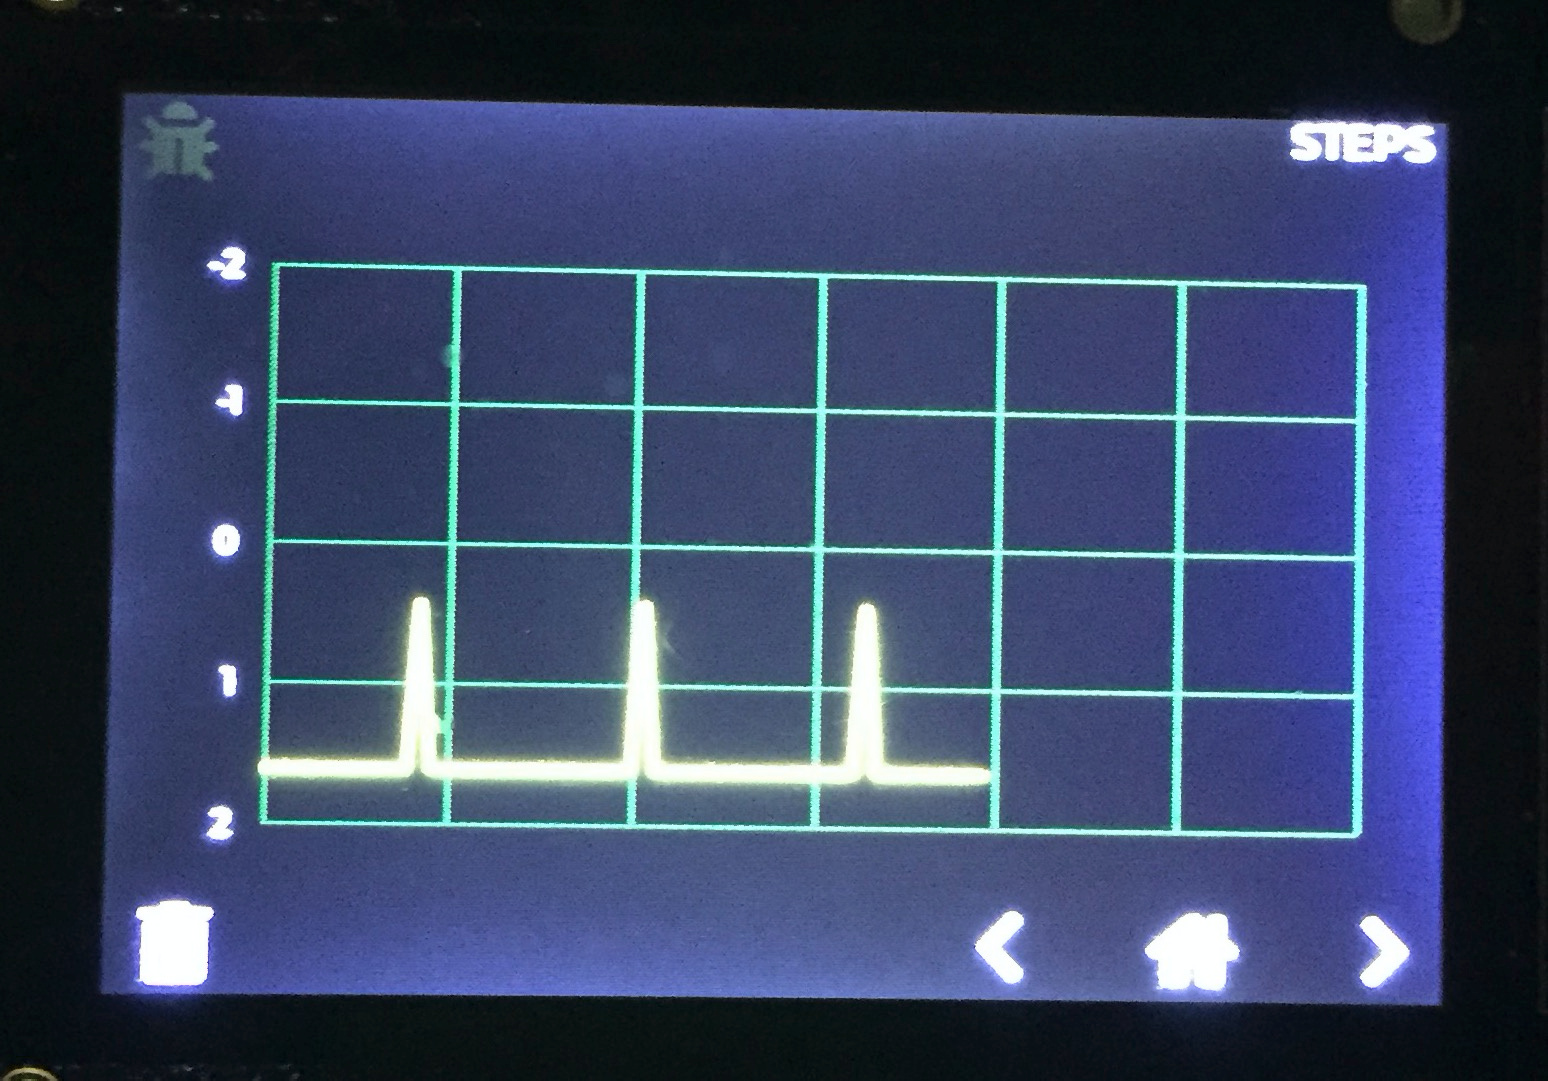
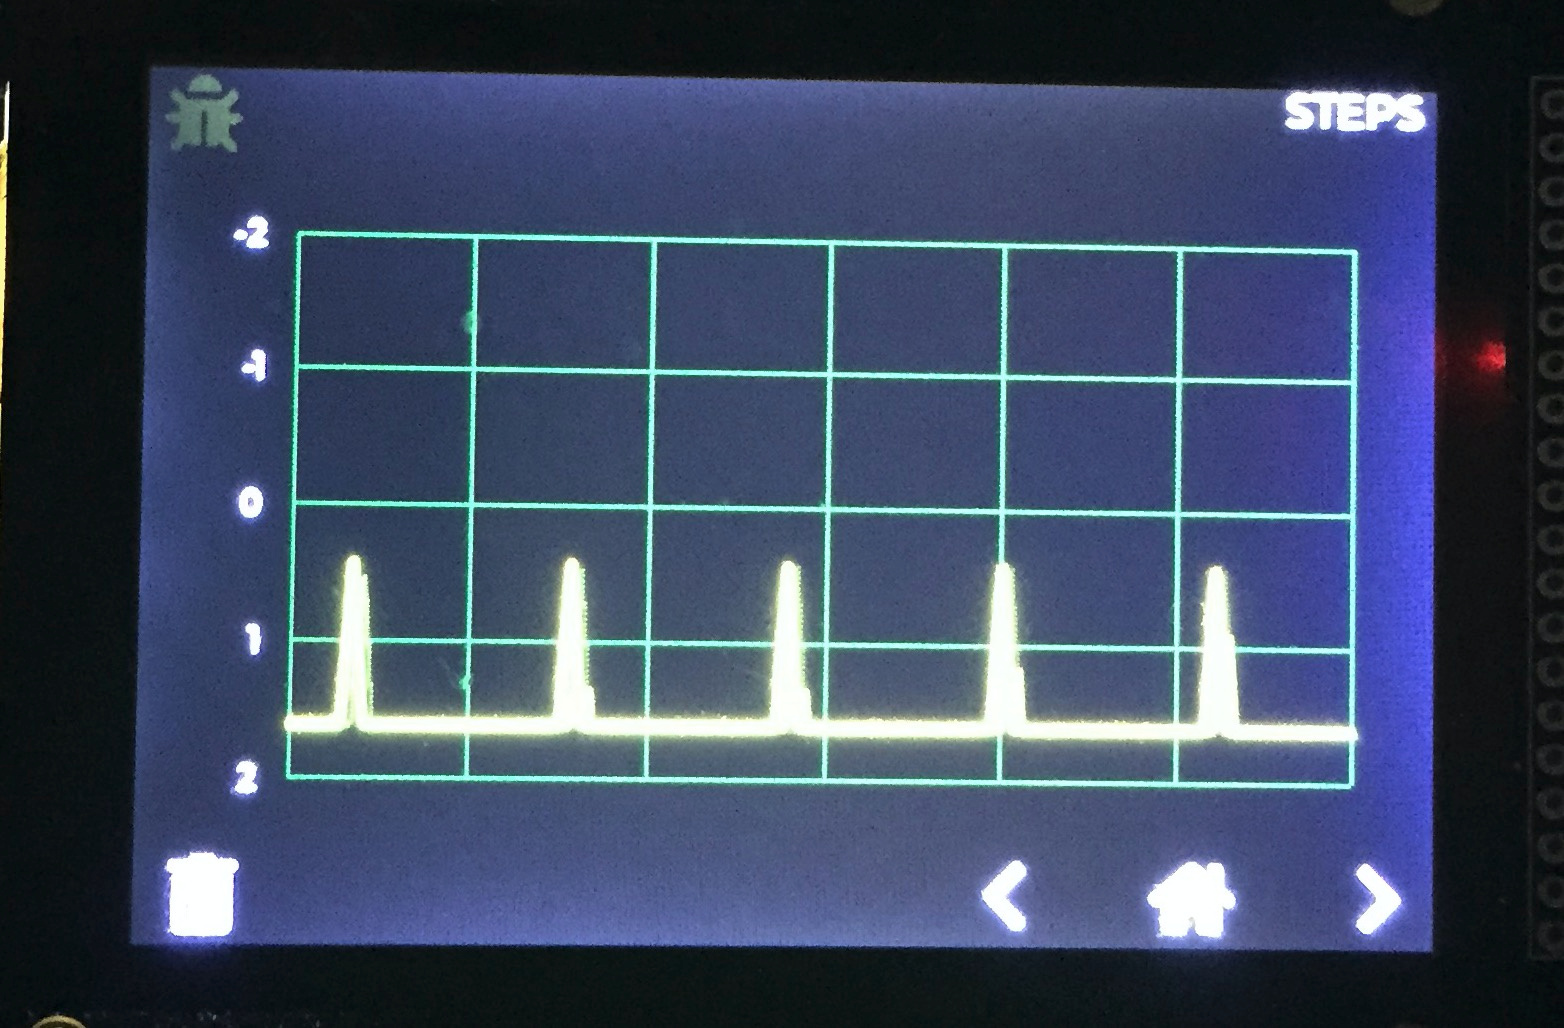
- Filling from the left. Provide a SHIFT mode where the the points after a chart clear are filled in from the left side of the chart, and shifting left starts only when the chart is full. This is a very common behavior for shifting graphs. As a work around, I implemented it using direct access to the points, but having it supported by the LV API will be great.
Filling left to right:
Shifting left to right once the chart is full:
-
Shifting the grid and X axis. As the data shifts lefts, it would be great to support also a mode where the vertical lines and the X axis shift as well. For example, a user provided call back function will provide the label for new X marks, and since chart update seem to redraw the entire chart anyway, this will not have a performance penalty.
-
Visual separation between newest and oldest points in circular mode. I tried the circular mode because of its faster frame rate but it’s not obvious visually where the old data ends and the new data starts. An option for a more visible separation will be great. E.g. a moving vertical line, a highlighted last inserted point, clearing N points ahead of the newest point, etc.