Hi,
I’m wondering how efficient the Chart’s shift mode (LV_CHART_UPDATE_MODE_SHIFT) is. I’ve created identical graphs using a Chart widget and a line widget. I compared their speeds and found the graph I made using the line widget slightly faster. I used shift mode for the Chart graph. Is this expected, or could I have incorrectly set up the shift mode?
Thanks!
Hi,
Exactly where did you measure performance difference? In rendering or adding new data?
Hi,
I’m measuring the draw time (refr_invalid_areas). The graph I created is just a sine wave that shifts to the left.
Many thanks
It’s interesting. Could you send some code snippets (about the built-in chart usage and custom solution too) so that I can examine what happens?
Hi,
Apologies for the late reply, I did not have access to the code until today.
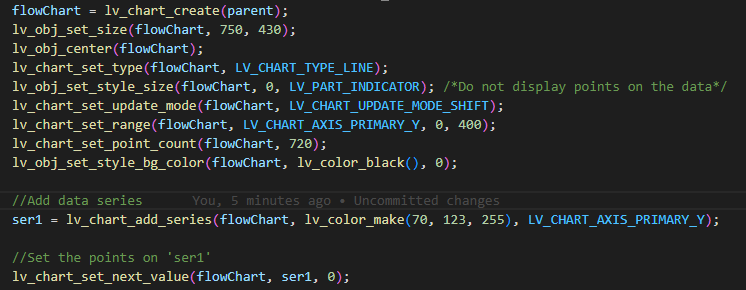
This is the graph made from the Chart widget:
I’m updating it using lv_chart_set_next_value()
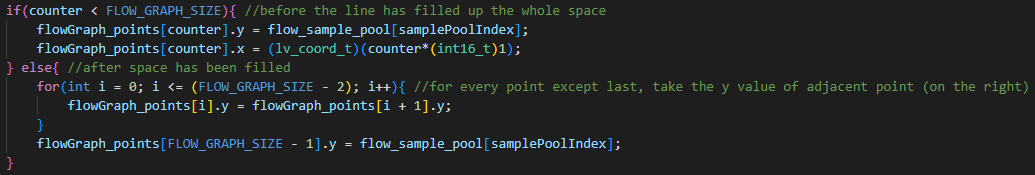
This is the graph made from the Line widget:
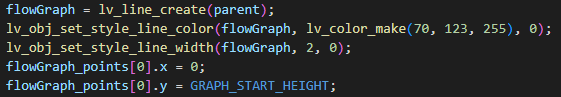
I’m updating it by inserting values into an array and then setting them using lv_line_set_points() like this:

Many thanks
Thank you! And how did you measure the performance?
I toggled a gpio pin high before refr_invalid_areas and low after it. Then I measured the time using an oscilloscope. Thanks!
I have any idea about what could be the difference.
Please comment out these two lines:
Please also check if the chart runs in crowded or normal mode.
I will give this a try when I get the chance. Many thanks for your reply.