Description
Using chart to log temperature from sensor, hourly for 24 hours. I have set up the x-axis with 25 tick marks which represent 0-23hrs and a 24hr that is not used. I have set up the y-axis for temperature with a range of 60F-80F.
What MCU/Processor/Board and compiler are you using?
M5Stack; esp32
What do you experience?
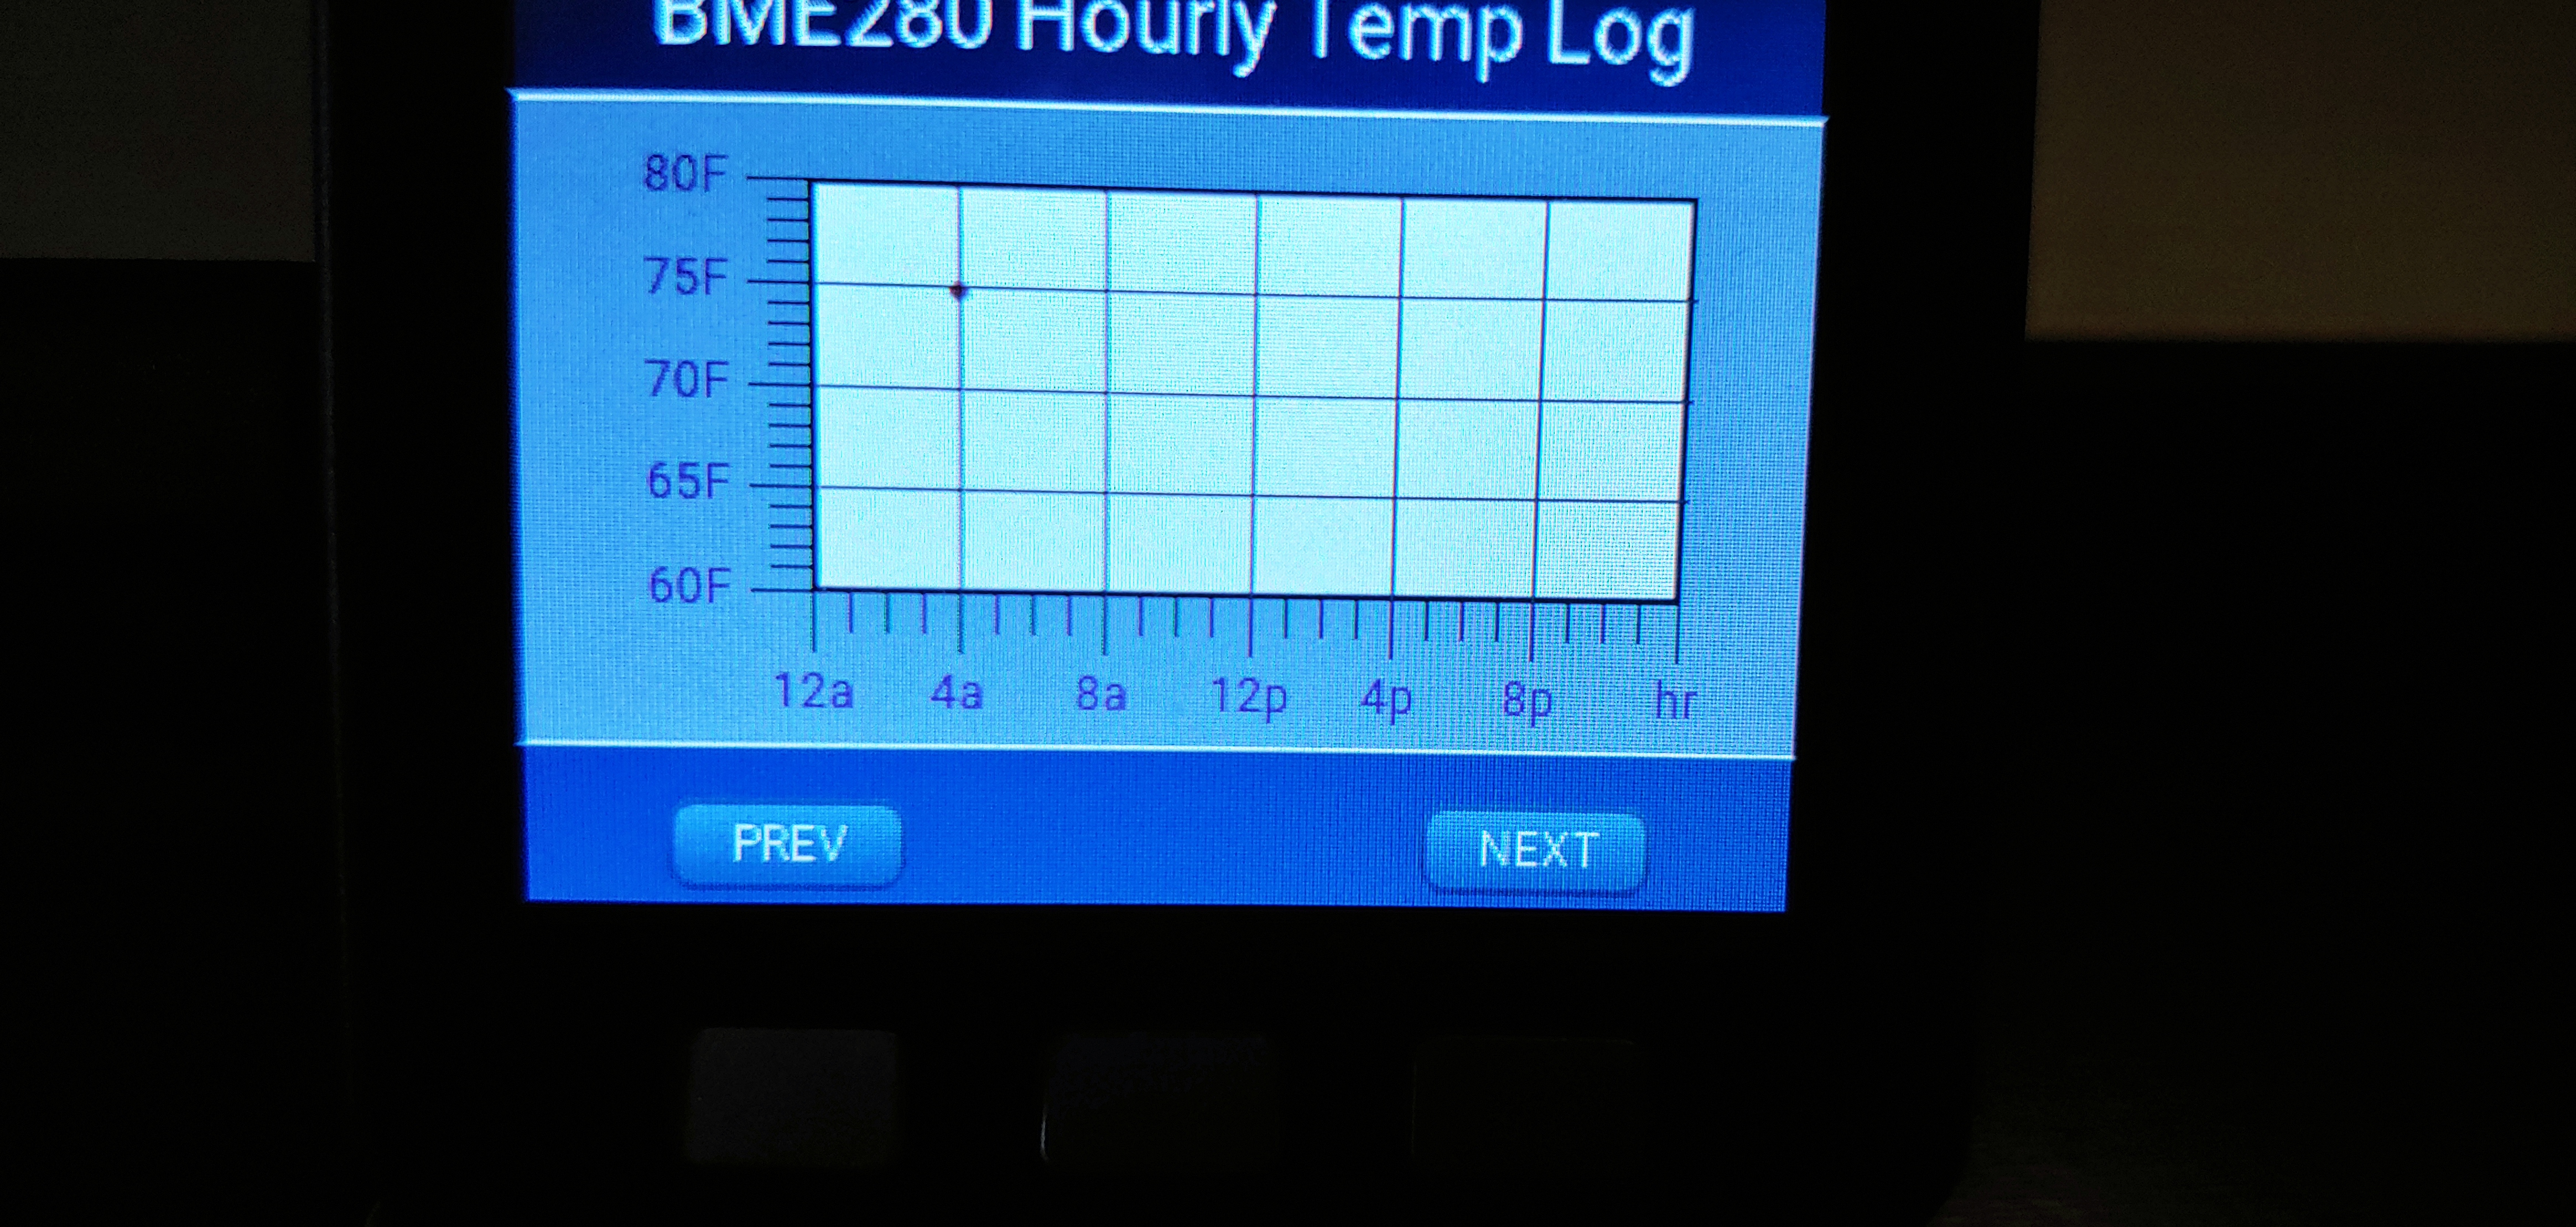
- When I place a temperature point on the chart for a particular hourly time the point drawn is off by -1px in the y-axis. The x-axis direction is fine.
- I believe I have configured the y-axis properly and to have 4px between tick marks. But for some reason the number of pixels between 60F and next minor tick mark is 5 pixels. All the other spacing between the rest of the y-axis tick marks is 4px. I adjusted the size of the chart in the height by +/-1 pixel to see if that would make difference and it did not. Maybe that is why the point is off by -1px.
- The horizontal division lines extend beyond the chart border by 1px on the right side.
What do you expect?
- The point to be drawn at the exact position in the y-axis.
- Have 4px between all tick marks
- Horizontal division lines that do not extend beyond chart border on the right side.
Code to reproduce
I am using C++, the first class function creates the chart in a container. The second function I just put in a constant temperature value and hour value so I could draw a point on the chart. The point should be drawn exactly where the horizontal division line of 75F and the vertical line of 4a intersect. I have tested other values with the exact same problem.
// Create the content pane for this view
    void ContentPane003::create(int width, int height)
    {
        Log::info(TAG, "Creating ContentPane003");

        // create style for the content container
        lv_style_copy(&content_container_style, &lv_style_plain);
        content_container_style.body.main_color = lv_color_hex3(0xaaa);
        content_container_style.body.grad_color = lv_color_hex3(0xaaa);

        // create style for temperature chart
        lv_style_copy(&temperature_chart_style, &lv_style_plain);
        temperature_chart_style.text.font = &lv_font_roboto_12;
        temperature_chart_style.text.color = lv_color_hex3(0x606);
        temperature_chart_style.body.border.width = 2;
        temperature_chart_style.line.width = 1;

        // create a content container
        content_container = lv_cont_create(lv_scr_act(), NULL);
        lv_obj_set_size(content_container, width, height);
        lv_obj_align(content_container, NULL, LV_ALIGN_CENTER, 0, 0);
        lv_cont_set_style(content_container, LV_CONT_STYLE_MAIN, &content_container_style);
        lv_obj_set_hidden(content_container, true);

        // create the temperature chart
        temperature_chart = lv_chart_create(content_container, NULL);
        lv_chart_set_style(temperature_chart, LV_CHART_STYLE_MAIN, &temperature_chart_style);

        // create a margin for text labels
        lv_chart_set_margin(temperature_chart, 42);

        // The x-axis of 219 = 2*2px (border) + 23*1px (23 inside tick marks) + 24*8px (24 spaces between tick marks, space = 8px)
        // The y-axis of 103 = 2*2px (border) + 19*1px (19 inside tick marks) + 20*4px (20 spaces between tick marks, space = 4px)
        lv_obj_set_size(temperature_chart, 219, 102);

        // Offset chart to fit content pane better
        lv_obj_align(temperature_chart, NULL, LV_ALIGN_CENTER, 20, -10);

        // Show lines and points
        lv_chart_set_type(temperature_chart, LV_CHART_TYPE_POINT | LV_CHART_TYPE_LINE);

        // The opacity of the chart
        lv_chart_set_series_opa(temperature_chart, LV_OPA_70);

        // The chart will use update mode circular
        lv_chart_set_update_mode(temperature_chart, LV_CHART_UPDATE_MODE_CIRCULAR);

        // The line width is 2px and point radius is 2px - has no effect if temperature_chart_style has style.line.width = 1
        lv_chart_set_series_width(temperature_chart, 2);

        // The 3 horizontal division lines will line up with 65F, 70F, 75F and 80F.
        // The 5 vertical divsion lines will line up with 4a, 8a, 12p, 4p, 8p.
        lv_chart_set_div_line_count(temperature_chart, 3, 5);

        // So the x-axis has an equal number of minor tick marks between major tick marks we set the point count to 25.
        // The points we will be updating will be from 0-23 (hours of the 24 hour clock) so we will never have a point
        // displayed a x-axis position 25.  In the labeling of the x-axis the 25th point is labeled "hr".
        lv_chart_set_point_count(temperature_chart, 25);

        // The y-axis range
        lv_chart_set_range(temperature_chart, 60, 80);
        temperature_ser = lv_chart_add_series(temperature_chart, lv_color_hex3(0xC00));

        // The count of 4 will actually place 3 minor tick marks between two major tick marks
        lv_chart_set_x_tick_texts(temperature_chart, TICKS_X_AXIS, 4, LV_CHART_AXIS_DRAW_LAST_TICK);

        // The count of 5 will actually place 4 minor tick marks between two major tick marks
        lv_chart_set_y_tick_texts(temperature_chart, TICKS_Y_AXIS, 5, LV_CHART_AXIS_DRAW_LAST_TICK | LV_CHART_AXIS_INVERSE_LABELS_ORDER);
    }

 // Update the chart
    void ContentPane003::update_chart()
    {
        int temp = 75;
        int current_hour = 4;

        temperature_ser->points[static_cast<lv_coord_t>(current_hour)] = temp;
        lv_chart_refresh(temperature_chart);
    }
Screenshot and/or video
Hourly Log 02 - shows point drawn is below horizontal line and vertical line is good. If you look close you can see the horizontal lines extend beyond the border on the right side.