Hi,
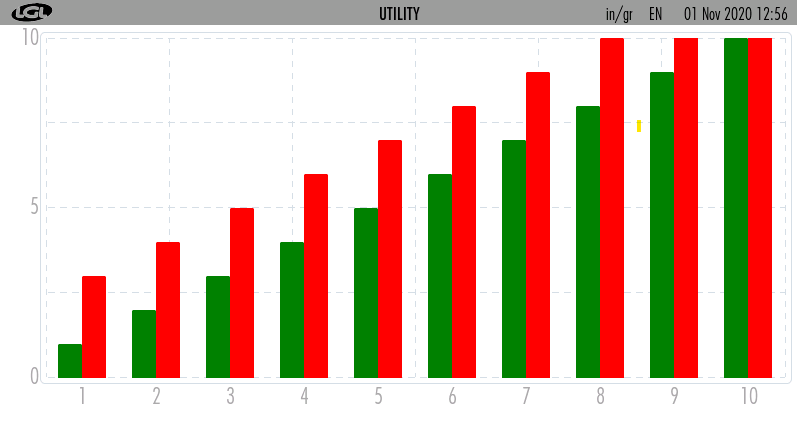
it’s possible change color only a single chart bar?
Thanks Walter
Hi
AFAIK, It doesn’t have a straight solution.
But 2 solutions come to my mind.
You can define 2 series with red and green colors. then set padding_inner to a negative value so they can cover each other. the green series will be used for data and the red one will be used for highlighting the index you need. if you set all values of the red series to zero except the chosen index, you can have this.
Define 2 charts with the same properties and set their position equally, so they can cover each other.
Hi @Ali_Rostami
thanks for answer.
I’m trying the first solution now. However, when I insert a second series, this is placed in succession to the first … and not “behind” … is it possible to position it exactly behind the other?
Thanks
Walter
Hmm, It was just an idea and I was not sure about it, but if it didn’t work the second method will work surely.
By the way, a better solution can be possible.
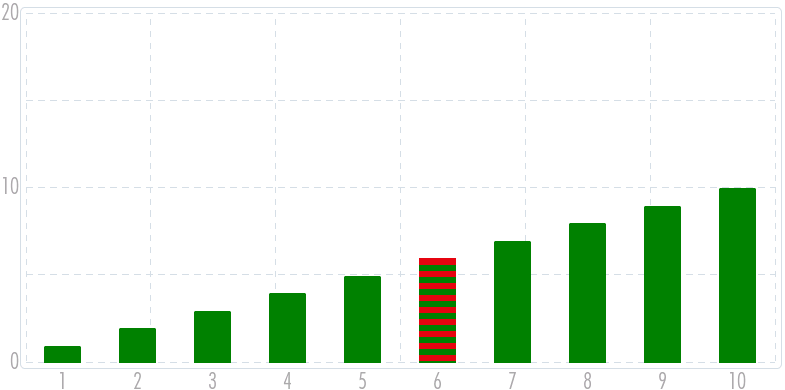
This is also an idea, but if it works it can be the best. I think you can use drawing a cursor on the chart. You need to set its width the same as a column so it can cover it. If you work on its style it can be drawn as a column with the color you want.
Thanks @Ali_Rostami,
today I try 
Hi @Ali_Rostami,
with the cursor it works
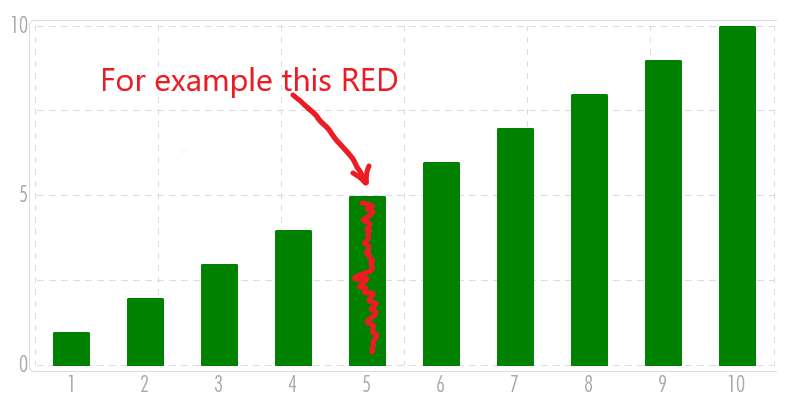
I just have to find a way to fill in the space between the red dashes
Thanks a lot
Hi again
Great, 
I think line_dash_gap is what you need now.
Hi,
Yes thanks.
I had found it.
Thanks again
Walter