Hi,
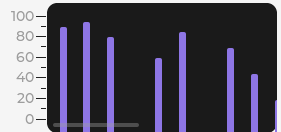
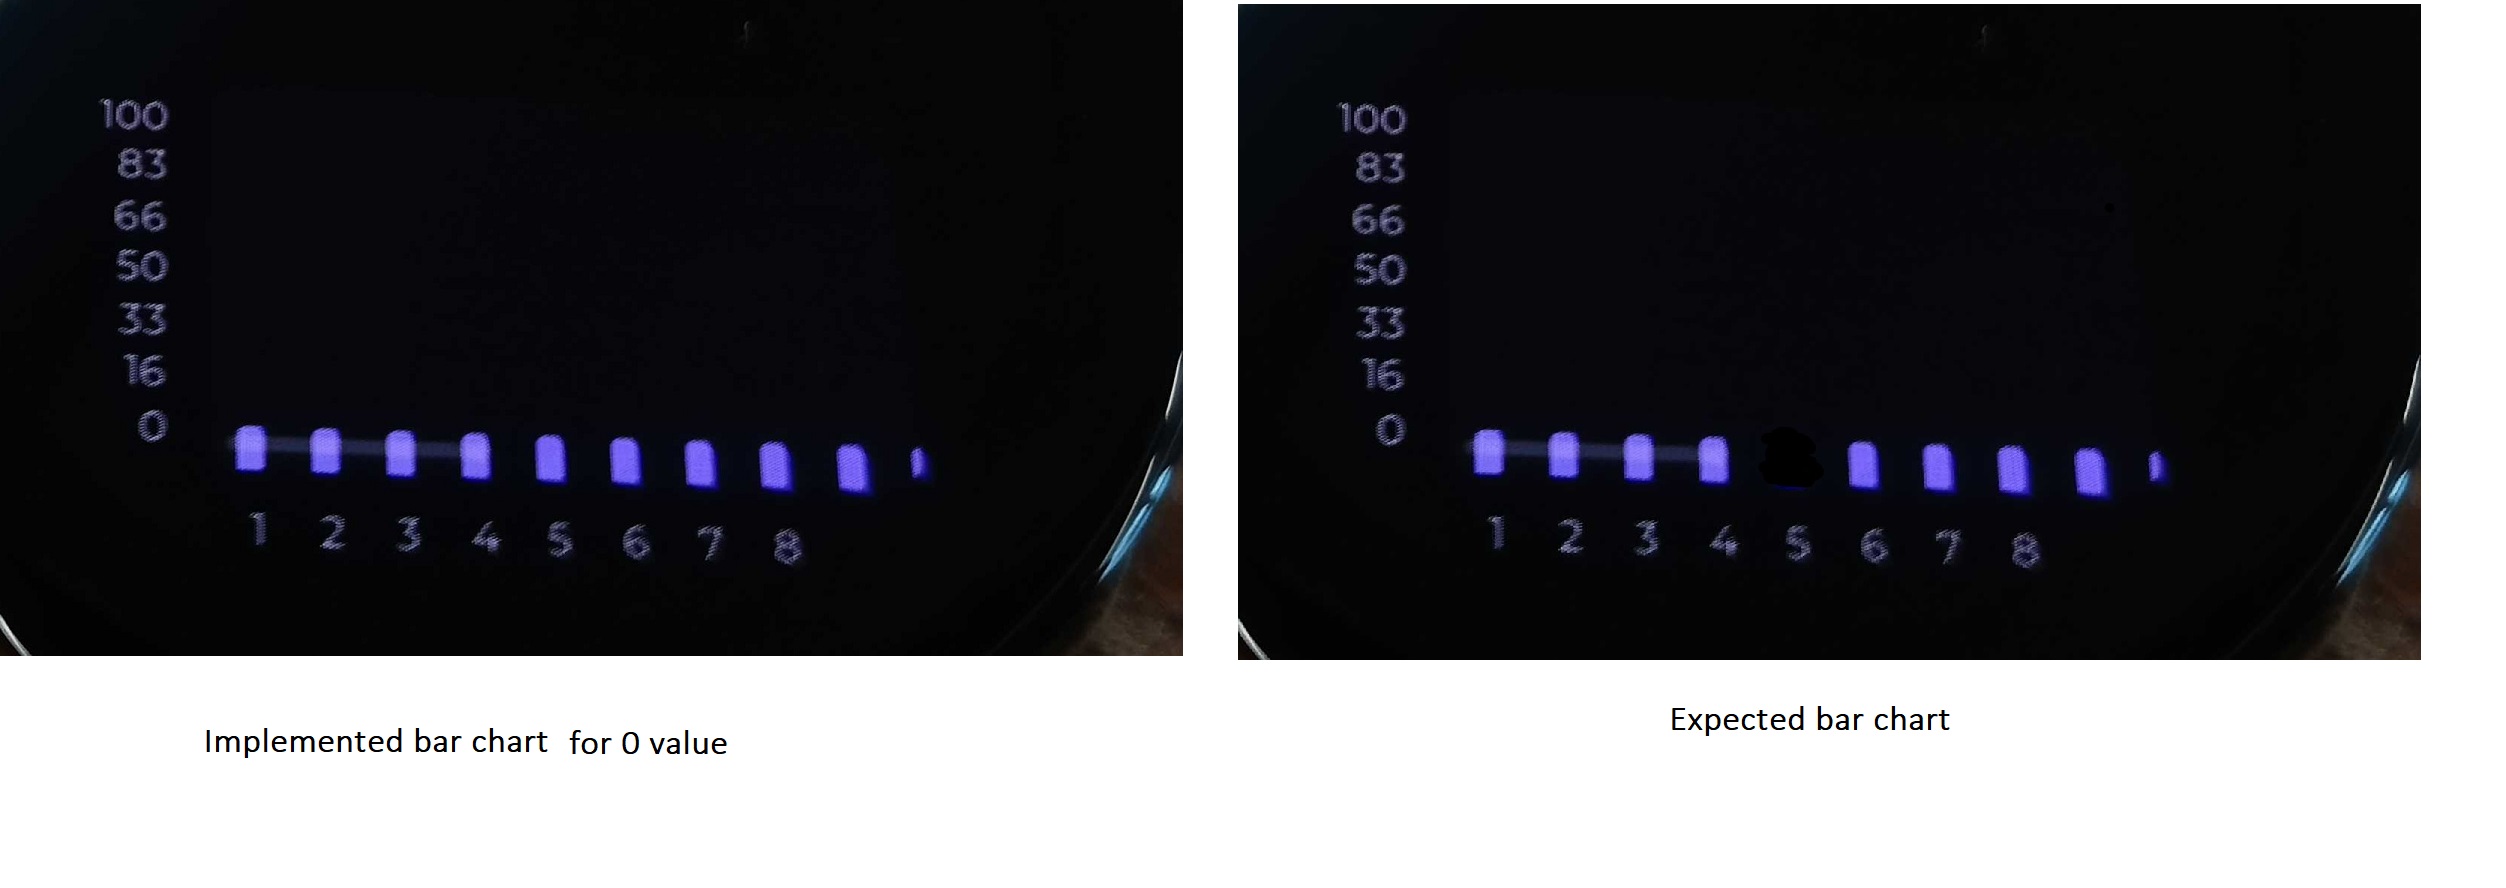
I have implemented bar chart using Axis ticks and labels with scrolling example. I’m able to plot all the values. But when there is no value present, its by default taking 0 value. So while plotting I’m expecting that when value is 0 it should not plot anything. But even for value 0 I’m getting small plot. I’m attaching the chart implemented by me & also the expected chart I want to achieve. How can we achieve it? Thanks in advance
There is a special value to not draw anything: LV_CHART_POINT_NONE
See here: Chart (lv_chart) — LVGL documentation
Thanks @kisvegabor for the reply. But can you please tell me how to use LV_CHART_POINT_NONE in code. For example, lv_chart_set_type(stress_chart, LV_CHART_TYPE_NONE ). I want to know how to use the given enum & in which API it need to be passed. I’m working lvgl v8.0
LV_CHART_POINT_NONE can passed as a value of a point. To make all points hidden you can use lv_chart_set_all_value(chart, ser, LV_CHART_POINT_NONE);
I don’t want to make all points in chart 0 or none. I just want if I’m getting zero value in buffer then at that point graph should not be plotted. I tried the API provided by you, but its making entire chart points zero. Wherelse my requirement is if any of the value in buffer is zero then at that point(x axis) only should not be plotted.
In this case when before adding a value just check if it’s zero and if so add LV_CHART_POINT_NONE instead.
Hey @kisvegabor I tried using the API, but still facing some issue. Sharing the code snippet, can you please take a look & tell me where I’m I making mistake.
bar_graph_code.txt (1.7 KB)
1 Like
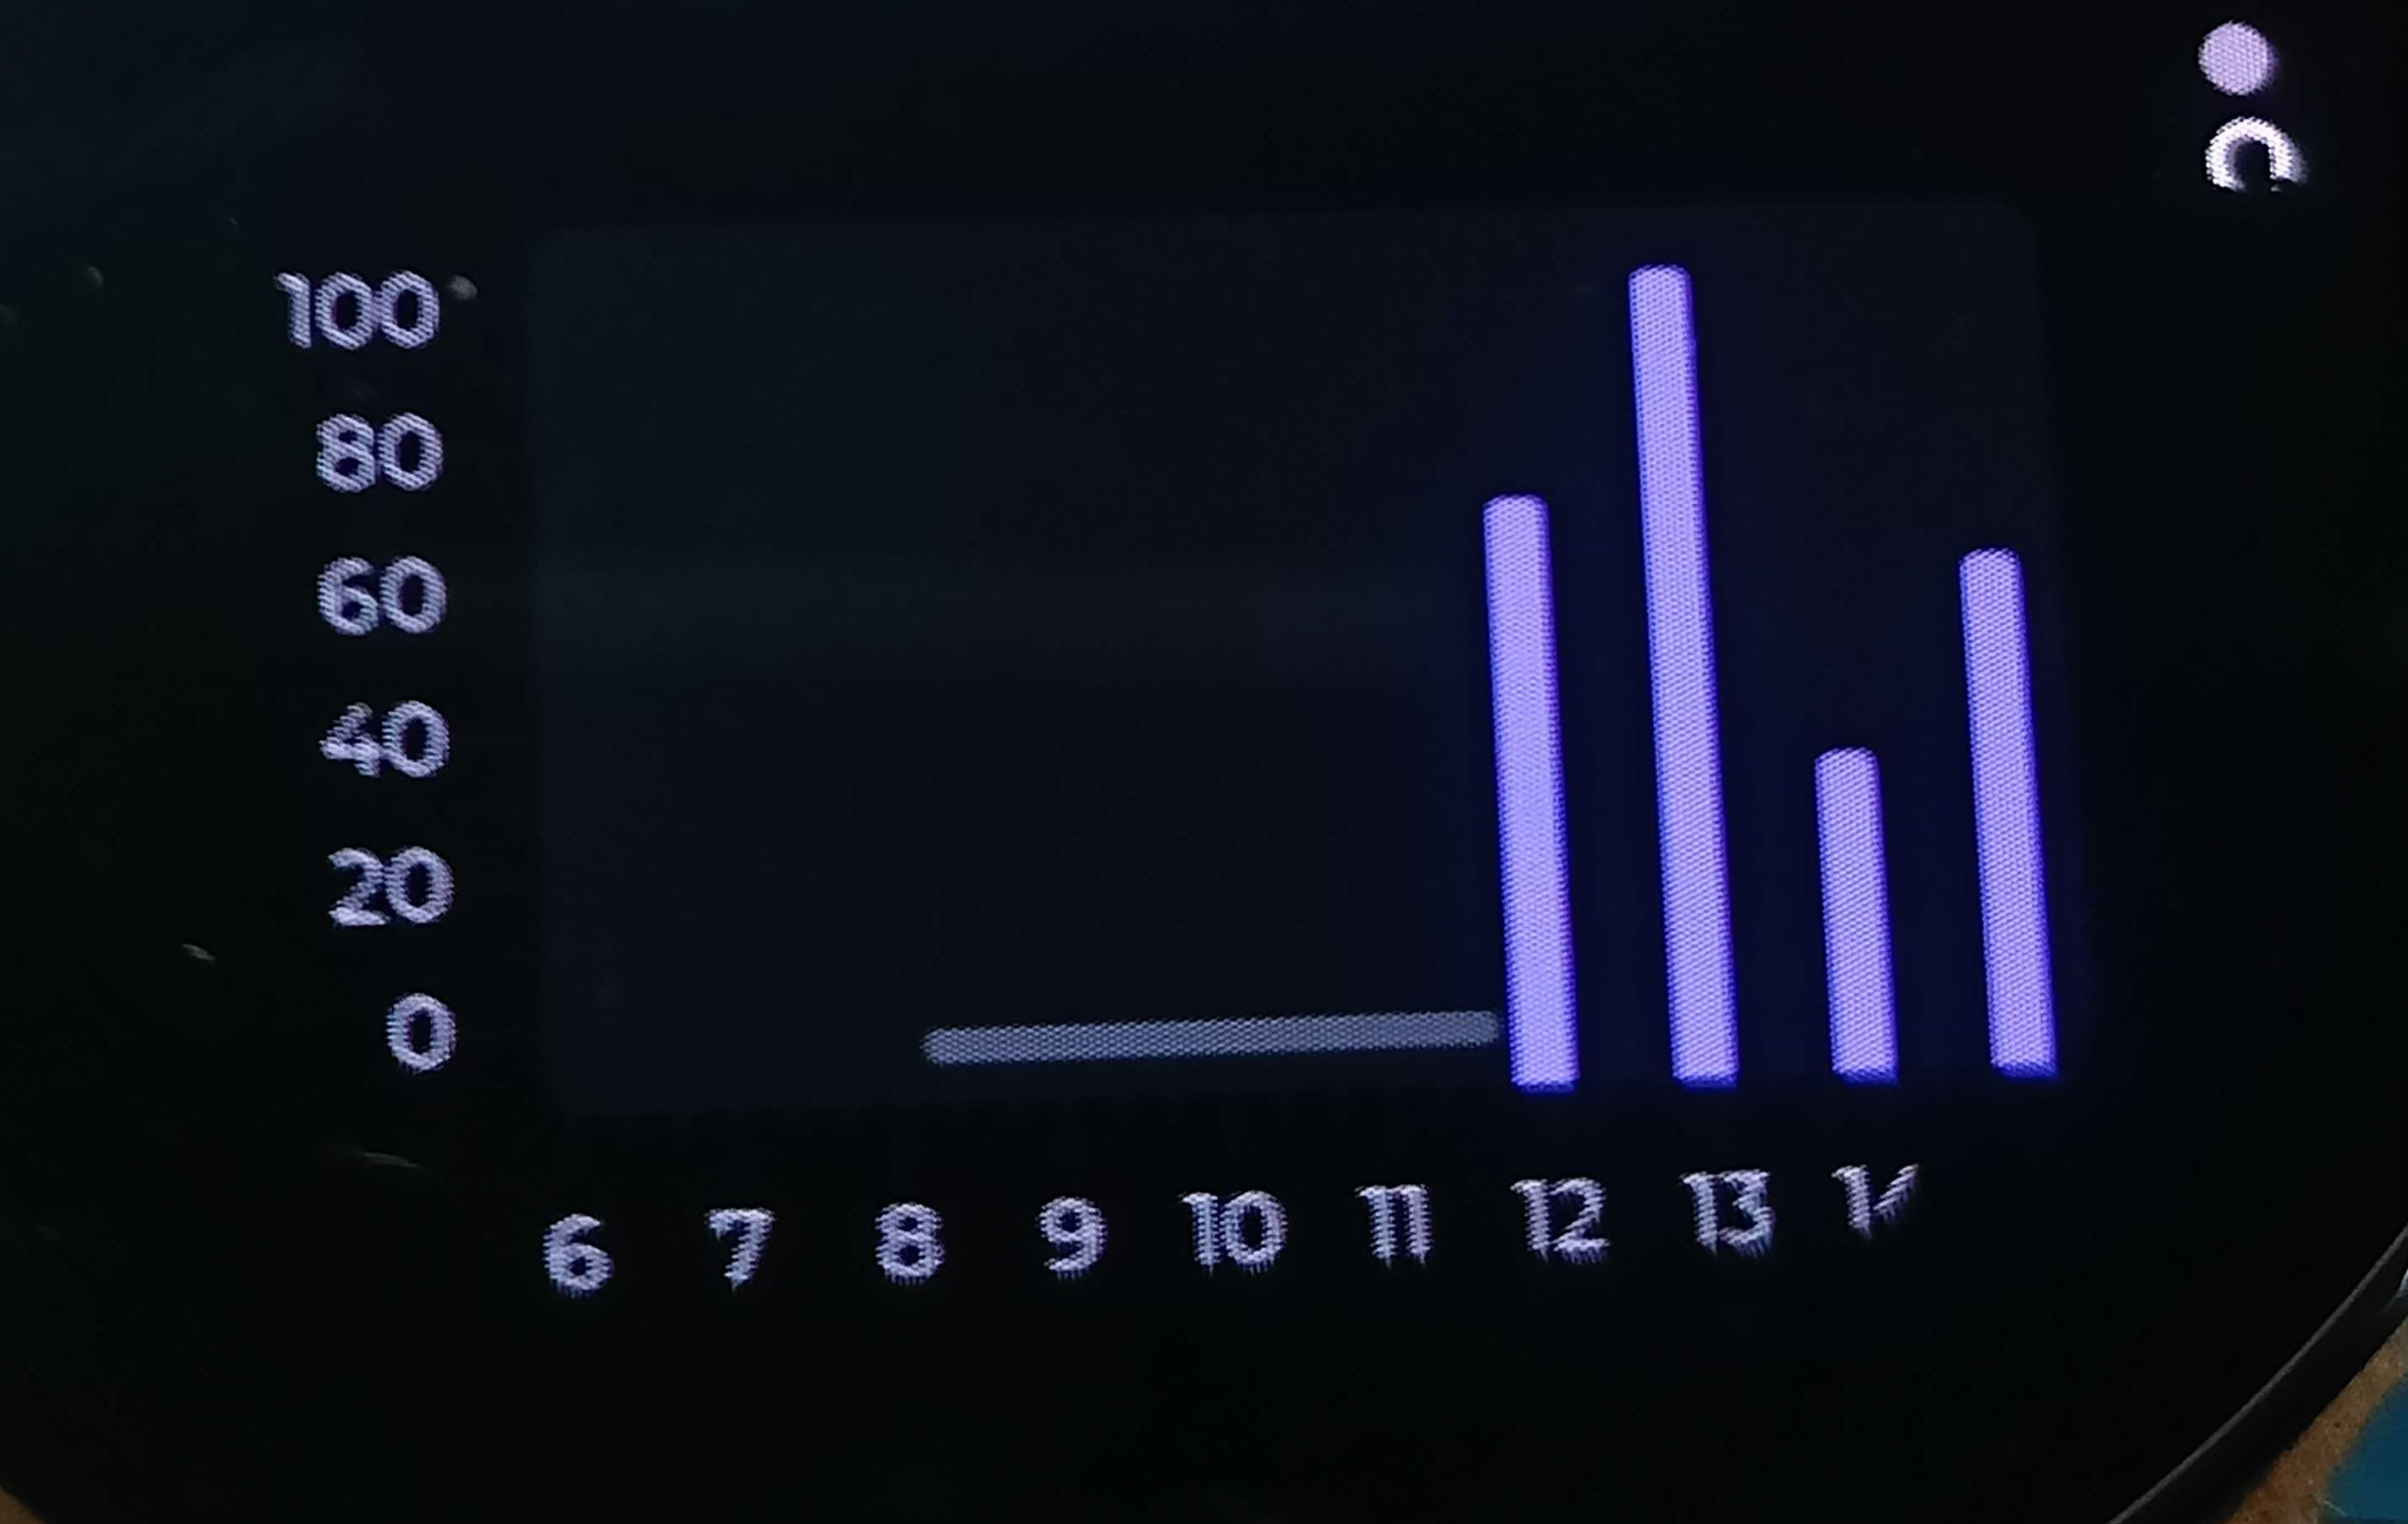
I’ve modified it to this:
//Use int16_t
//Change 0-s to LV_CHART_POINT_NONE
int16_t stress_data_set_buffer[] = {90, 95, 80, LV_CHART_POINT_NONE, 60, 85, LV_CHART_POINT_NONE, 70, 45, 20, LV_CHART_POINT_NONE, 68, 100, 32, 59, 90, 23, 78, 12, 45, 76, 10, 68, 67};
  for(i = 0; i < 24; i++) {
      lv_chart_set_next_value(stress_chart, ser1,stress_data_set_buffer[i]);
  }
and got: