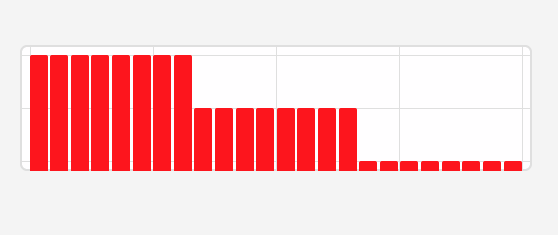
I am new, but have searched the LVGL posts and web examples. In lv_example_chart_4, alignment with the graph value of 100 and graph value 50 with the upper axis value appears correct, but the base of all the bars does not align with the zero axis. A value of zero produces a bar with a length of 20. This can be seen on the LVGL Web Examples. Below is a screen shot of a simplified lv_example_chart_4.
Am I missing something?
