Description
I want to draw two graphs in an XY-coordinate system on a 800x480 pixel TFT.
What MCU/Processor/Board and compiler are you using?
My board is custom made based on the ESP32S3 processor.
What LVGL version are you using?
Version 9.2
What do you want to achieve?
I perfectly looking XY-coordinate system with two graphs.
What have you tried so far?
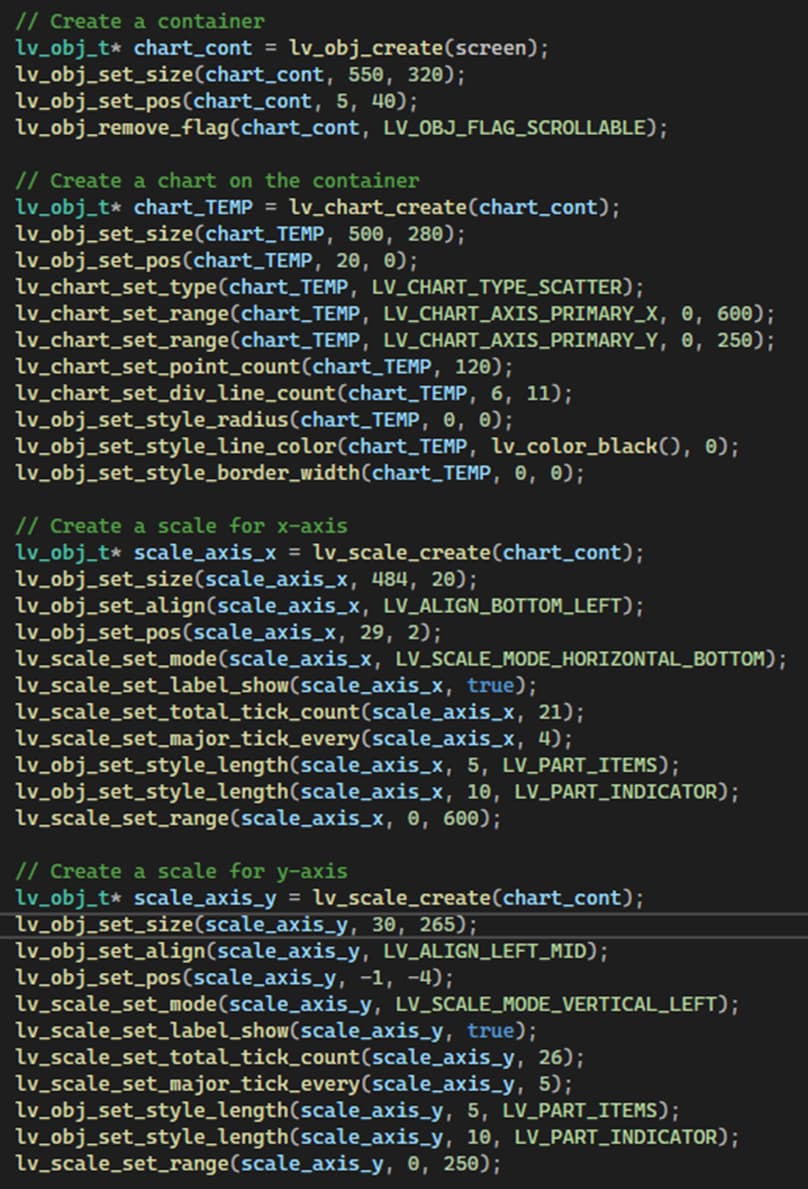
I use the graph widget for the graphs and the scale widget for the x-ais and for the Y-axis. I set about 10 division lines in graph. I set tick marks using scale. That is all fine.
My problem is how to align the axes to the graph. I have fiddled for a long time changing the position and the size by one or two pixels at a time. I have achieved a useable result, but there must be a more elegant way, but how?
I call lv_obj_set_size, lv_obj_set_align and lv_obj_set_pos. Then I use cut and try adding or subtracting a few pixels to make the best match between chart and the two axes, but that is rather time consuming, hence my thought is that there is a smarter way to get the right position and lengths of the axis.
How???
Screenshot and/or video
Regards,
Jorgen