Hi
I use for littlevgl for my personal project which is in early development stage.
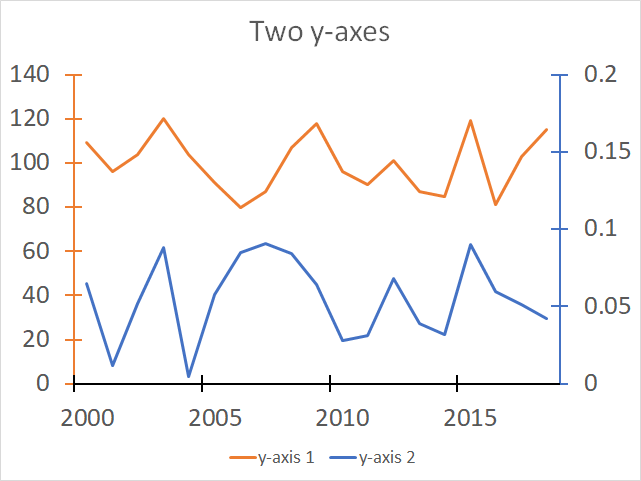
For my use case it’s handy to have two Y axes on both sides of the chart (usually when you have two graphs that represent different values). See picture below for example. Another interesting feature might be inversion of labels set by lv_chart_set_y_tick_texts() . One of the minor problems for me is that usually values on Y axis start from lower left corner while all displays have their (0,0) point in the upper left corner.
So to maintain Y axis labels like on the picture below one should pass string like “120\n100\n80\n…” which is not too convenient.
If you, guys, are OK with these options (and if they are not already available) I can make a fork of littlevgl and try to implement those feature by myself, so in case if everything goes well they can be merged into mainline.
Regards, Vadym.