What do you want to achieve?
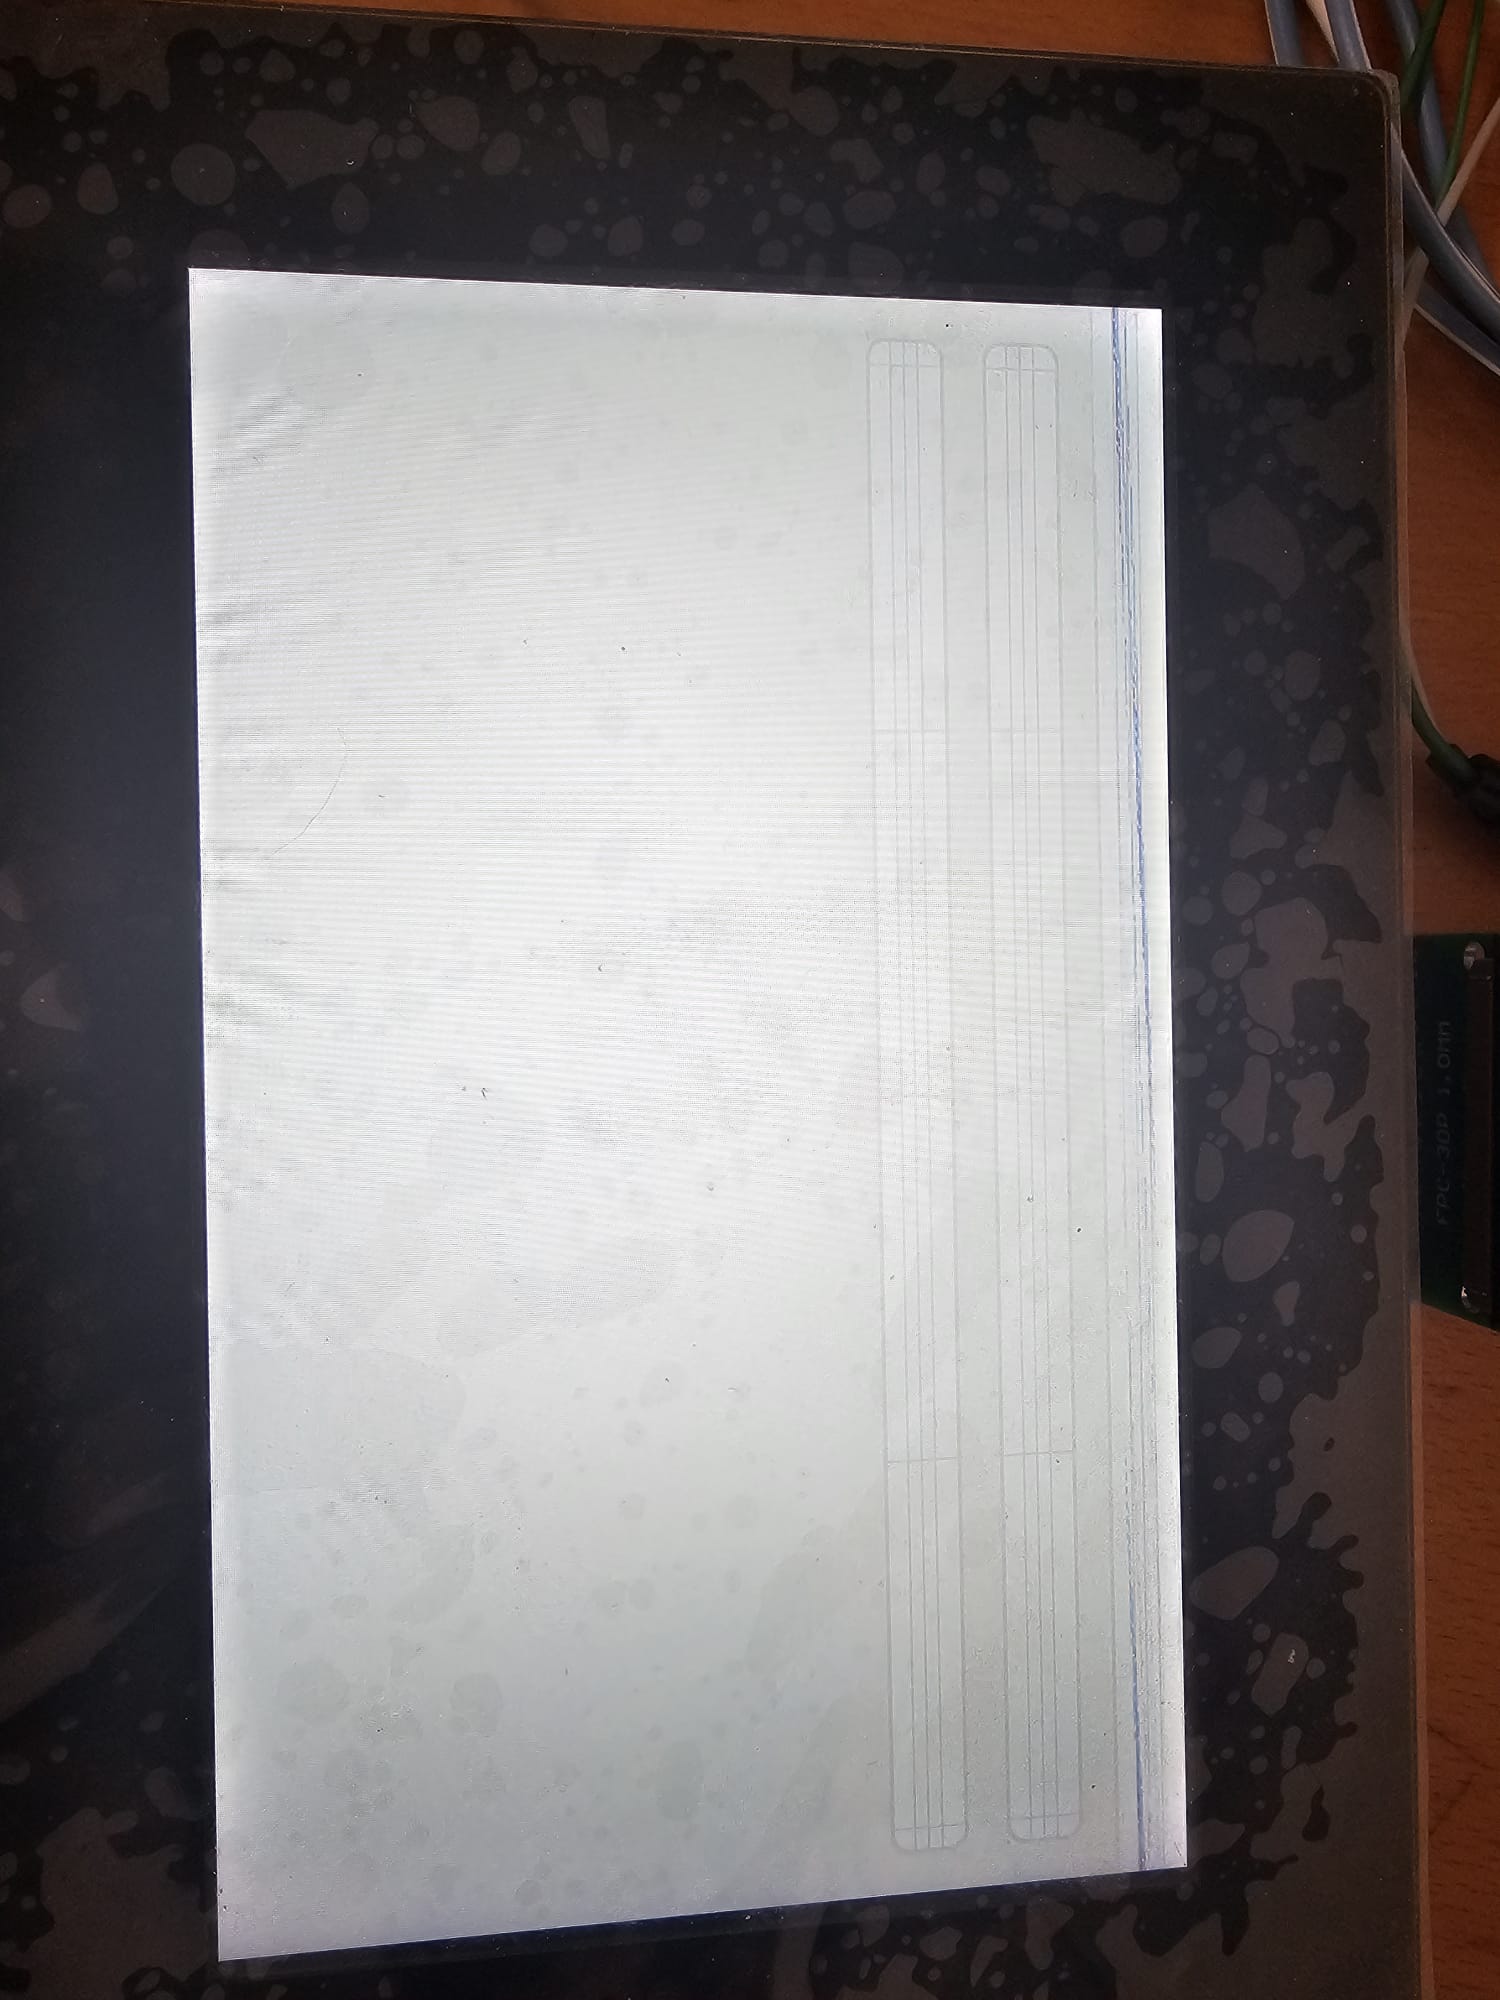
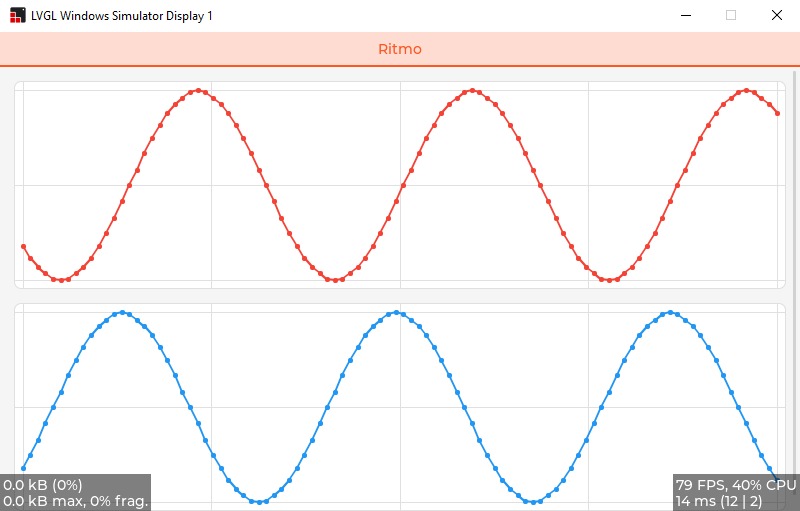
I’m trying with the same code both on the simulator for windows and on my board. I would like to get two graphs on two different lines. On the simulator everything is OK, While on my custom board it doesn’t work.
Obviously I have already tested writing/displaying static things on the screen and it works perfectly
What have you tried so far?
Code to reproduce
static lv_obj_t* chart;
static lv_chart_series_t* series;
static lv_obj_t* chart2;
static lv_chart_series_t* series2;

#define CHART_POINT_COUNT 100

static void update_chart_cb(lv_timer_t* timer)
{
    static int t=0 ,t1 = 100;
    int new_sample = (lv_trigo_sin(t % 360) * 50) / LV_TRIGO_SIN_MAX + 50;
    lv_chart_set_next_value(chart, series, new_sample);
    t += 10;
    int new_sample2 = (lv_trigo_sin(t1 % 360) * 50) / LV_TRIGO_SIN_MAX + 50;
    lv_chart_set_next_value(chart2, series2, new_sample2);
    t1 += 10;
}

static void analytics_create(lv_obj_t * parent)
{
    lv_obj_set_flex_flow(parent, LV_FLEX_FLOW_COLUMN);

    chart = lv_chart_create(parent);
    lv_obj_set_size(chart, lv_pct(100), lv_pct(50));
    lv_obj_align(chart, LV_ALIGN_TOP_MID, 0, 0);
    lv_chart_set_type(chart, LV_CHART_TYPE_LINE);
    lv_chart_set_range(chart, LV_CHART_AXIS_PRIMARY_Y, 0, 100);
    lv_chart_set_point_count(chart, CHART_POINT_COUNT);
    lv_chart_set_update_mode(chart, LV_CHART_UPDATE_MODE_SHIFT); // sposta i dati
    series = lv_chart_add_series(chart, lv_palette_main(LV_PALETTE_RED), LV_CHART_AXIS_PRIMARY_Y);

    chart2 = lv_chart_create(parent);
    lv_obj_set_size(chart2, lv_pct(100), lv_pct(50));
    lv_obj_align(chart2, LV_ALIGN_BOTTOM_MID,0,0);
    lv_chart_set_type(chart2, LV_CHART_TYPE_LINE);
    lv_chart_set_range(chart2, LV_CHART_AXIS_PRIMARY_Y, 0, 100);
    lv_chart_set_point_count(chart2, CHART_POINT_COUNT);
    lv_chart_set_update_mode(chart2, LV_CHART_UPDATE_MODE_SHIFT);
    series2 = lv_chart_add_series(chart2, lv_palette_main(LV_PALETTE_BLUE), LV_CHART_AXIS_PRIMARY_Y);

    lv_timer_create(update_chart_cb, 50, NULL);
}
Screenshot and/or video
Environment
- MCU/MPU/Board: STM32F746BGT6
- LVGL version: 9.3.0